A variety of metrics exist in the area of machine learning. There are the classics like recall, precision and f1- score and the more exotic ones like Normalized Discounted Cumulative Gain. Whatever application you are trying to develop there is probably already a metric in place to evaluate it. Hence, it is difficult to have a thorough understanding of all of them.
This article is having a look at mean Average Precision (mAP), a popular metric in object detection. It will show what it is, what to be aware of when using it and what relation it has with the underlying data.
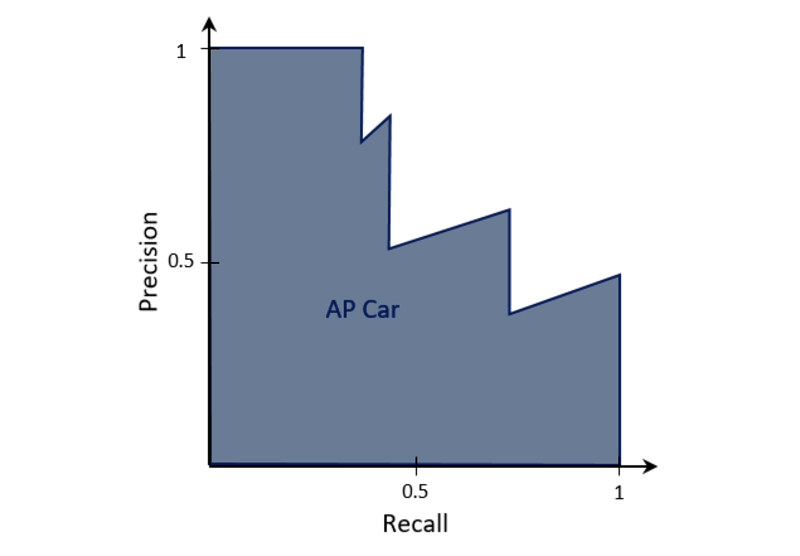
As the name suggests, it is the mean of the Average Precision (AP) of each object class. Average Precision is the area under the Precision-Recall curve of an object detector for one class. In the first figure an example of the AP for the class car is given.
The exact calculation of the area under the curve can vary depending on which benchmark you are looking at. Also, the Intersection over Union (IoU) you considering as sufficient for a positive detection can influence the numbers.
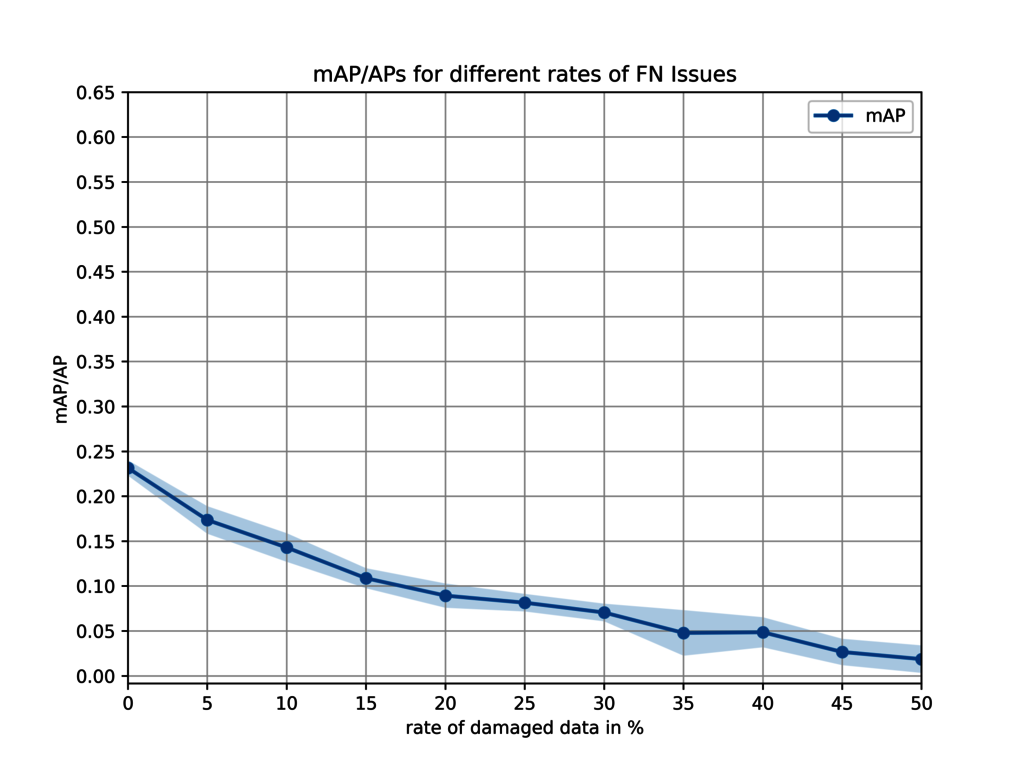
In this setting each class is weighted equally but this is often not the case when having a look at the underlying data. In many datasets the number of objects from each class strongly varies and often huge imbalances exist. Hence, not all classes are equal. In the figure below a mAP from earlier analysis about the importance of data quality is shown. We artificially corrupted data at different rates to evaluate the impact of label quality. This is the data (KITTI dataset) for false negatives:
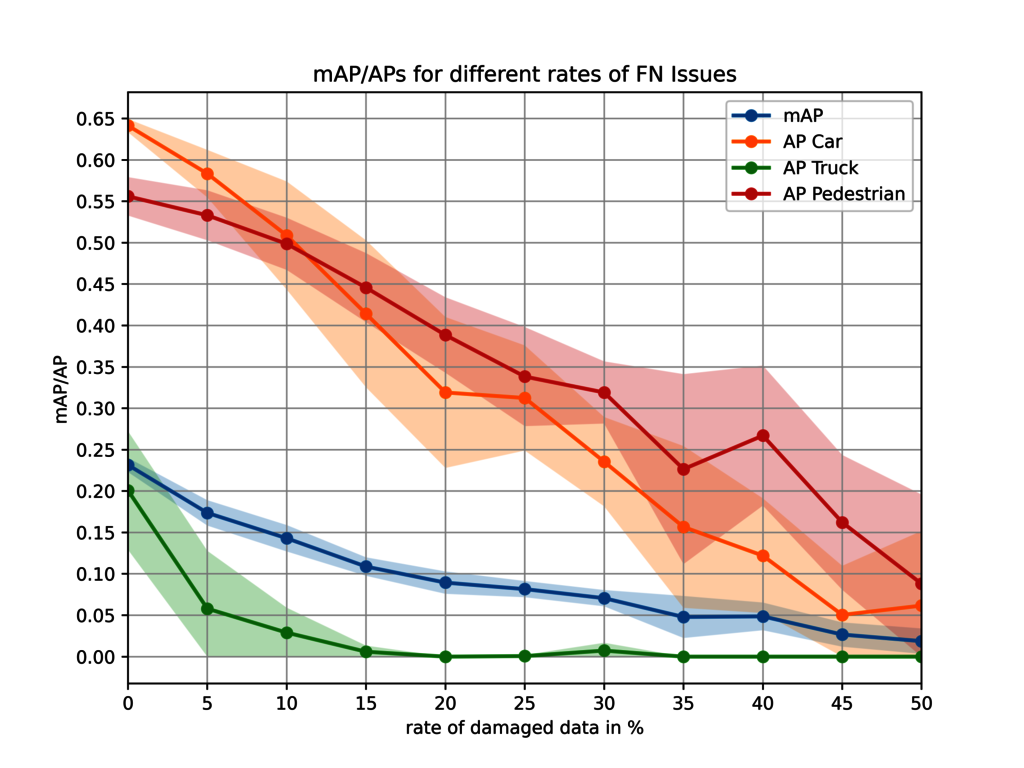
The mAP is 0.23, which is not a great value to begin with, goes down to almost zero at 50% of false negatives. This gives the impression that the trained object detector (Retina Net) does not perform great overall. But the reality is that mAP is hiding some of the details. In the figure below we additionally show the AP for the classes car, pedestrian, and truck.
It shows that the detector works quite well for the classes car and pedestrian, but not so great for trucks. By averaging all APs, the overall mAP gets reduced. Also, the class truck is significantly more impacted by quality issues than the others.
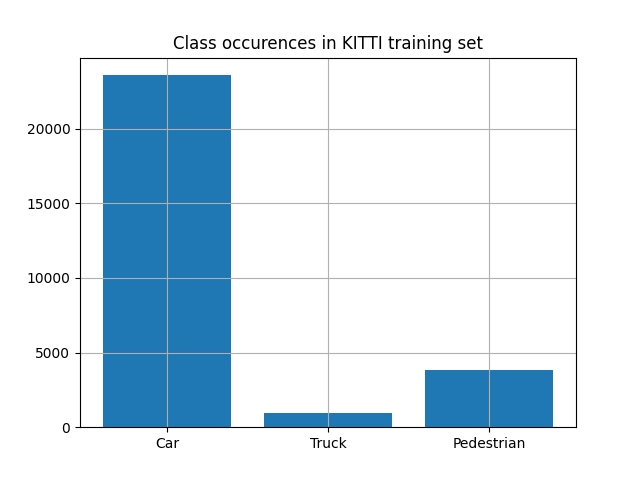
The difference in performance across classes can be explained when looking at the dataset. Below are the class occurrences in the training set.
The class truck has significantly less samples compared to the two others, hence a subpar performance for this class can be expected. Furthermore, this indicates that there might be no problem with the neural network architecture but rather with the data used to train it. An example like this shows that a single number like mAP can only provide limited insight and it is important to understand all aspects of how it is derived.
With our know-how and software solutions, we tackle problems like this and carefully analyze datasets to ensure class imbalance doesn’t happen. Additionally, our QA processes ensure that the same label quality is guaranteed, for both frequent and rare classes. Through this we can ensure high quality datasets in all aspects.